This website uses cookies so that we can provide you with the best user experience possible. Cookie information is stored in your browser and performs functions such as recognising you when you return to our website and helping our team to understand which sections of the website you find most interesting and useful.
Vyhledávání
Postprocessing
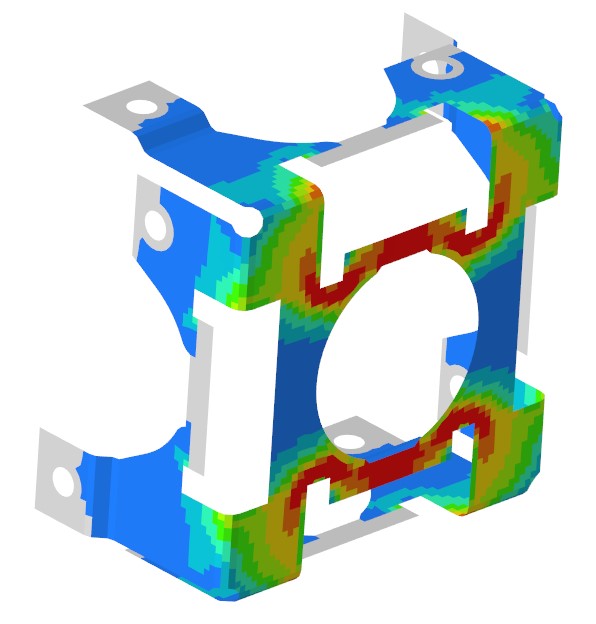
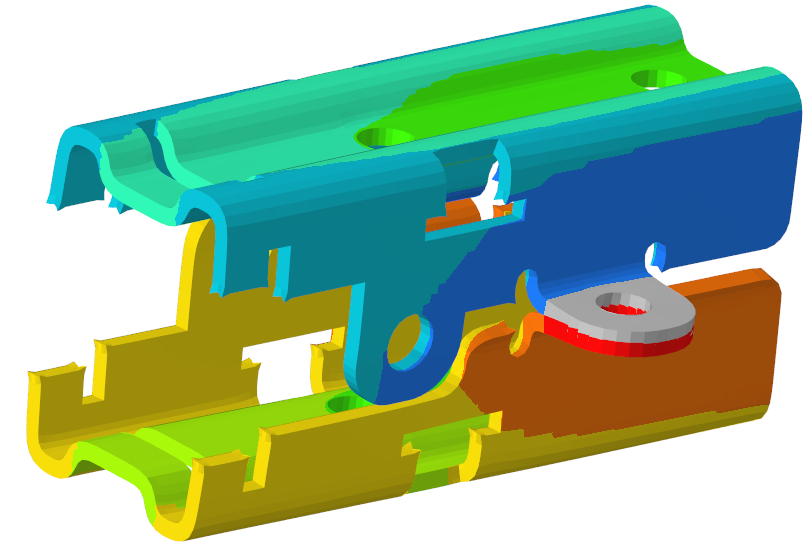
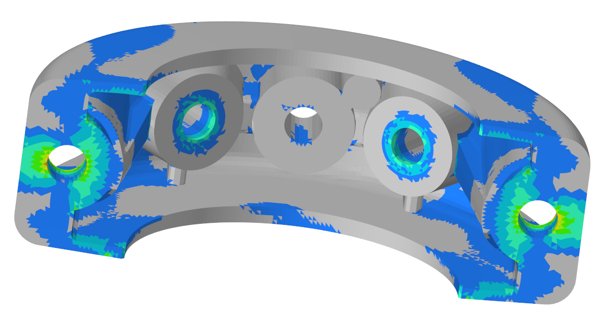
After the analysis (solver run) is successfully completed, it is possible to view the results. To enable this, the postprocessor uses a graphic window to show the input model of the analysis together with the resulting physical quantities, defined as output by the user. The results can be shown in multiple ways such as a colour map, including a scale, or using graphs or tables. Most attributes of the results show can be fully adapted by the user (colour, scale range, deformation intensity, result description and others). For a better orientation in the results, you can hide or show only some parts of the model, make cross-sectional cuts, show physical quantities just for a part of the model. The results can be combined, or used in mathematical functions.
Other options involve drawing up presentations of analyses by creating images and videos from animations showing the behaviour of the analysed model. A many postprocessors can also generate files directly, for example, a PowerPoint file or an HTML file based on the selected template of the calculation report or presentation.